Analyzing the New Proposed Open Enrollment Funding Model
March 31st, 2026
The total price tag on statewide open enrollment could land close to $40m annually if the amendment introduced in Wednesday’s hearing moves forward.
The original version of SB 101 required sending districts to pay at least 80% of their cost per pupil to receiving districts. In the amendment, open enrollment funding is modeled after the public charter school funding mechanism, and funding is transferred at the state level. What that means:
-
Base adequacy funding for that student goes to the RECEIVING district ($4,351 in FY 27)
-
If the student is eligible for free lunch or is an English language learner, the RECEIVING district receives additional aid ($2,441 for free lunch recipients; $849 for English language learners)
-
If the student has an Individualized Education Program, special education differentiated aid goes to the SENDING district, which is still responsible for all special education costs and service provision ($2,229)
-
The RECEIVING school receives an additional grant from the state ($5,200 per student in FY 27)
Estimating take up
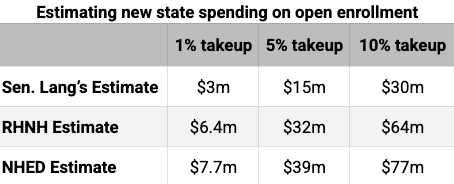
A first step to understanding cost is understanding how many students will use open enrollment. In his testimony, Sen. Lang cited research showing that between 1 and 2% of students used open enrollment in its first year, so he estimated the program would enroll 3,000 students (2%) in year 1. An analysis from the NH Department of Education, obtained by the Concord Monitor as part of a Right to Know request, used 1%, or 1,489 students.
Though these are reasonable estimates for year 1, research has shown that open enrollment programs grow to between 5 and 10% of the public school student population. For that reason, this analysis looks at costs for a takeup rate of 7%, acknowledging that takeup will be lower in year 1 and grow over time. Seven percent of NH’s projected 2026-27 enrollment is roughly 10,400 students.
Estimating the cost
A simple way to estimate the cost to the state is to consider only the $5,200 additional open enrollment grant. Because the adequacy and differentiated aid amounts are the same cost regardless of where the student enrolls, you could consider that a net 0, and simply multiply $5,200 by the expected number of open enrollment students. This is the method NHED used, acknowledging that exact costs will vary depending on where a student lives and where they enroll. Using this method and a 7% takeup rate yields a projected cost of $55 million annually.
In his testimony, Sen. Lang used a different method. He considered total per pupil spending by the state at traditional public schools relative to total per pupil spending by the state at charter schools. Because there is a $2,000 difference, he multiplied projected enrollment by $2,000. Using that 7% takeup rate, this method would yield an eventual projected cost of $21 million annually. (In his testimony, Sen. Lang cited a $6 million cost assuming 2% takeup.)
The challenge with this method, however, is that it includes the Statewide Education Property Tax (SWEPT) in the traditional public school per-pupil amount. As we have written before, SWEPT is not really state spending; the money is raised and retained locally. Including SWEPT in the calculation would lead you to believe that the state spends roughly $7,000 per student, but when you remove SWEPT, the state in fact sends only an average of $4,700 per student from the Education Trust Fund. (Towns that raise enough in SWEPT to cover the calculated cost of an adequate education receive no money from the state – more on that below.) Another way to think about this: when a student leaves their district school for a charter school or an open enrollment school, the district school loses that student’s adequacy and differentiated aid, but does not lose any SWEPT money, because SWEPT is retained by the district and cannot be applied toward their charter or open enrollment tuition.
We can improve upon Sen. Lang’s calculation by looking at the difference between what the state pays per charter school pupil – roughly $9,000 – and what the state pays per traditional public school pupil, not including SWEPT – roughly $4,700. That difference is $4,300, which comes out to $45 million for 7% of students.
RHNH approached this estimate by calculating the average amount districts receive beyond adequacy and differentiated aid (since, as we’ve noted, adequacy and differentiated aid remain unchanged). On average, districts receive an additional $1,135 per student through extraordinary needs grants and fiscal capacity disparity aid. (We did not include hold harmless grants in this calculation, since those calculations should remain unchanged by open enrollment.) We compared this amount to the additional $5,200 open enrollment grant, as illustrated by the equations below.
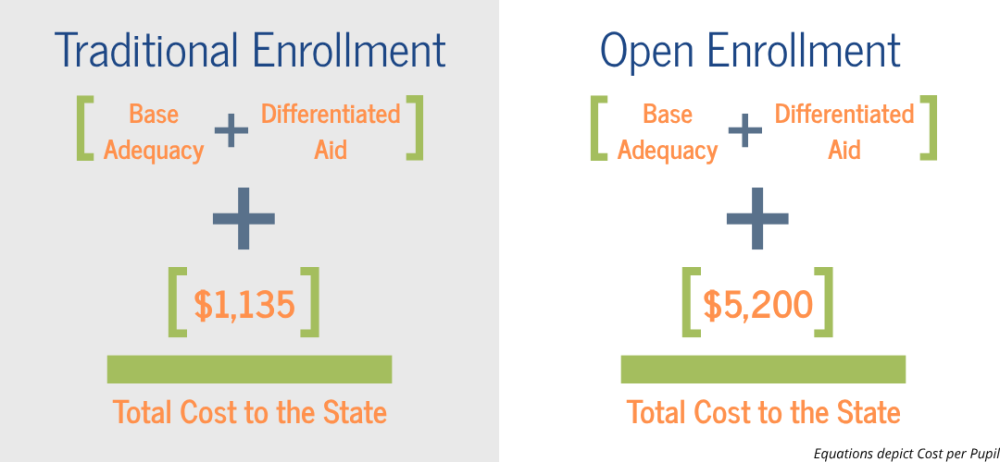
The difference in the “bonus” amounts is $4,065. Assuming a 7% takeup rate, that projects to $42 million in new state spending annually.
Note: Calculations based on NHED FY27 estimates. SB 101 would go into effect in FY28.
Some complications
The math is complicated by a couple factors. First, as we mentioned, is SWEPT. The actual calculation for what the state pays a traditional public school looks something like:
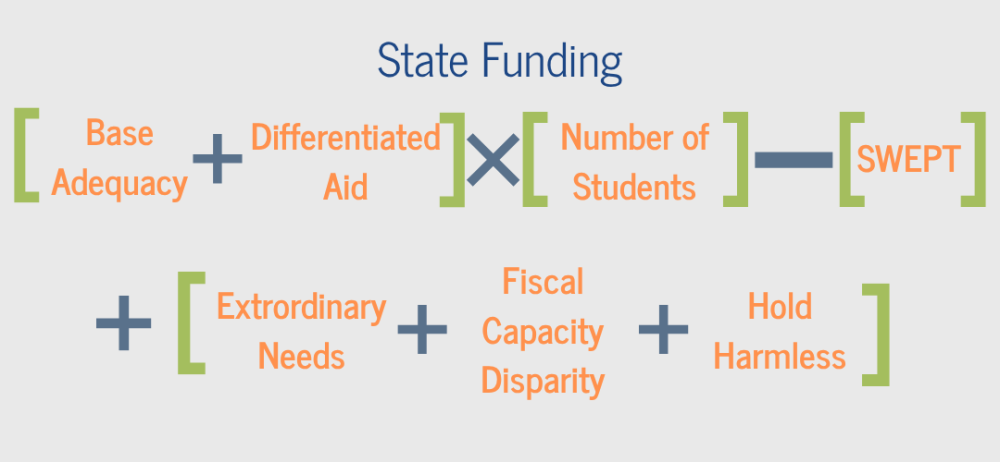
Essentially, the amount a town raises in SWEPT is subtracted from the total amount they are owed, and the state pays the difference. In towns that raise more in SWEPT than they need to cover the cost of an adequate education, the state pays nothing. It is not clear whether these towns would be expected to cover open enrollment costs from their excess SWEPT. For instance, if a student open enrolls into Rye, which raises about $2 million more in SWEPT than it needs, would Rye use that $2 million to cover adequacy and the open enrollment bonus for a student? Or would the state send Rye the money despite their excess SWEPT? If it’s the former, that would be a net savings for the state, though this begins to recreate the system of redistributing SWEPT that many towns fought. (If it’s the latter, it’s the same as if a student transferred into a town that does not raise excess SWEPT – Rye receives approximately $10,000 from the state to cover adequacy and the open enrollment bonus.)
On the other hand, if a student left Rye because, say, Exeter was more convenient for their parents, the entire cost of that student’s education would be a new expense for the state. Whereas the state was paying nothing for the student to attend Rye, they are now paying adequacy and differentiated aid (if applicable) plus the open enrollment bonus – so, roughly $10,000 in new spending.
The calculations are also complicated by extraordinary needs grants, which consider property value per free lunch eligible student, and fiscal capacity disparity aid, which considers property value per student. Charter school students are not included in these calculations for their resident districts. We can assume such would be the case for open enrollment students, but we don’t know if they’d be included in the counts for their receiving district.
Regardless, it means that the precise cost depends on where a student is coming from and where they are going. There are 5 towns where the per pupil cost of extraordinary needs grants and fiscal capacity disparity aid is greater than the $5,200 open enrollment bonus: Berlin, Claremont, Greenville, Hinsdale, and Newport. If a student left one of these towns for an open enrollment school, that would likely be a net savings for the state, albeit a small one.
Implications
No matter how you cut the data, this policy will introduce new state spending. While new spending on public education is generally cause for celebration, this new spending is likely to flow to districts that don’t need it. And at the same time Republicans are pushing for this open enrollment policy, they have rejected policies that would have expanded access to free lunch, increased school building aid funding, or ensured school districts received full reimbursement for special education. All of these bills had an annual price tag between $5 and $16 million, less than the eventual annual cost predicted for open enrollment.
If the goal is to ensure that every student, regardless of zip code, has access to a high quality education, we should invest that $40 million in the schools that are facing budget cuts or struggling to sustain the programs families love. Such an investment, targeted toward schools in lower property wealth communities, would allow schools to fix out of date buildings, pay and retain teachers, fund enrichment activities, provide more free lunches, and relieve the burden on local property taxes. Spending $40 million to allow 7% of students to move to different schools will only further entrench divides across zip codes.